NBA
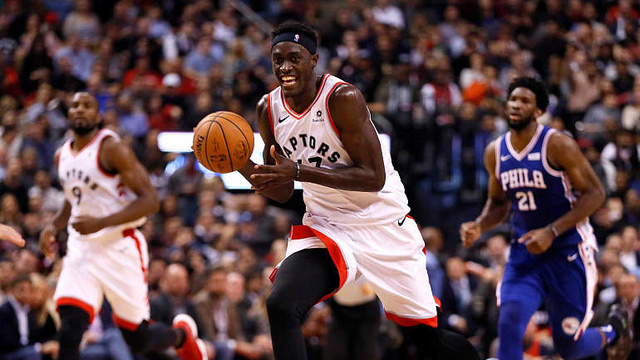
Pascal Siakam: How EcoStats Prove His Value in a Salary Cap Era
What’s a player worth?
The hardest thing to do in contemporary sports is to precisely calculate the value of a player: Do you measure his contribution to team wins? His ability to affect the game from a defensive standpoint? The number of points he scores?
My answer is somewhat provocative: His price.
What if I told you that LeBron James’ true value to a team is not his propensity to get an enviable combination of points, rebounds and assists? What if a triple double means less than a $401K? And I don’t mean that from a dollars and cents standpoint, I’m talking from a winning basketball standpoint.
Through my work for TSJ101, I have become fascinated with the cost of winning: How much does a championship cost?
Breaking Down Pascal Siakam And The PER Stat
As the Raptors beat writer for this site, I’ve noticed something I found interesting. Obviously, Kawhi Leonard is clearly the best Raptor on the floor whenever he plays, but Pascal Siakam is not that far behind. The best statistic in the NBA to approximate their relative contributions to the team is a handy stat called PER (Player Efficiency Rating).
Created by ESPN columnist John Hollinger, it’s essentially an attempt to condense a player’s contributions into a number. It’s quite simple. The higher the number, the more productive the player. (You are essentially calculating a player’s positive contributions.)
Somebody like Anthony Davis leads the NBA with a PER of 30.9, while an average player like Greg Monroe of the Raptors, for example, has a PER of 13.5 (NBA stars generally have a PER over 20 – with Leonard ranking 4th in NBA per at 27.3, James ranking #7 in the NBA at 26.3 and Kevin Durant ranking #12 in the NBA at 24.8).
Obviously, stats do not tell the whole story, but they also provide some interesting analysis. While Hollinger’s PER stat does not define players, it’s generally considered a strong indicator of performance across the NBA. (For more information on how this stat is calculated, please check out www.basketballreference.com)
While I truly enjoy PER though, I find it incomplete.
Why The PER Stat Is Incomplete?
There is a very simple reason for this fact: We are now in a salary cap era.
It is not enough to be good as a player, you also have to be cheap.
A common strategy in the NFL is to build around a talented rookie quarterback. Is this because rookie quarterbacks are better than veteran quarterbacks? Hardly. It’s because they’re cheaper.
Let’s look at the Super Bowl as an example. This Sunday, we have two of the game’s best QBs squaring off: the 41-year old Tom Brady vs 24-year old Jared Goff. Nobody is quite sure who will win, and the game should be quite exciting. For me though, what I find more interesting is their relative cost: Tom Brady is one of the game’s best, has taken a pay cut and makes $20.5 million a year. Jared Goff’s salary? Would you believe he only costs $7 million ($6,984,418 to be exact).
This disparity is not an insignificant fact.
The difference between their salaries is $13 million – for one position. It’s a big economic advantage for the Los Angeles Rams, as they can spend that $13 million on other team needs as they see fit.
Enter my new way of evaluating players: EcoStats.
I have created a new way of evaluating athletes: through statistical analysis relative to economic cost.
Breaking Down Kawhi Leonard And Pascal Siakam And Their PER
Back to the Raptors, Leonard has a PER of 27.3 while his teammate Siakam has a PER of 18.3 (approaching stardom, but not quite there yet statistically). Obviously, the major difference between them? Leonard has a salary of approx $23 million this season, Siakam makes approx $1.5 million. Utilizing PER, I have created a designation for EcoStats: “ECO” (from my economics student days).
Therefore, I have calculated Leonard’s EcoPER is $846,669 while Pascal Siakam’s EcoPER is $84,424. (Quite simply, I’m using PER to assign a dollar value per unit of measurement.) So if we think of one unit of PER being equal across the NBA (which is the whole point of the statistic in the first place), Leonard costs 10 times as much as Siakam for the exact same production!!
I will continue to utilize EcoStats in future articles, but it’s essential to view players within an economic context when the leagues are in a salary cap era. For context, Goff’s actual QB rating is slightly higher at 98.7 than Brady’s 96.8, and while these numbers are extraordinarily similar, Brady’s EcoQB rating is 3 times Goff’s – meaning he costs three times as much as Goff for less production!!
I also believe that by evaluating contemporary statistics through the prism of economics, we can get a more accurate analysis of a player’s impact on a team. In a salary cap world, it’s not enough to be good: You have to be a good deal.
Siakam is one of the best contracts in the NBA – and EcoStats prove it.
Follow us on Twitter: @T101Sports @T101SportsNBA
Follow us on YouTube:
Subscribe to get the latest news from TSJ and the TSJ 101 Sports TV YouTube channel! Play and win weekly at Thrive Fantasy!
Photo Credit
James Anderson via Flickr


